Does Montana have a good economy?
Overall, yes. Montana has a good economy. GDP and inflation in Montana have grown steadily for decades, and in recent years, the unemployment rate has hit record lows. However, certain aspects of the state economy do not perform as well as others.
Wages and personal income in Montana have remained well below the national average for decades. And, while it’s easy to find a job in Montana, the labor market is inconsistent across industries, and low wages present challenges for many residents.
To answer the question of whether or not Montana has a good economy, we need to consider several economic indicators, from employment and wages to income inequality and poverty.
In this article, we examine each indicator for Montana’s economy, grading each one from “poor” to “excellent” to comprehensively answer the question, “Does Montana have a good economy?”.
Video summary of this blog (3:45)
Visit us on YouTube for more content like this on Montana.
Montana’s economy – Good or bad?
Table of contents:
- Unemployment: Excellent
- Wages: Average
- Per capita personal income: Average
- Income inequality: Poor
- Gross Domestic Product (GDP): Good
- Inflation: Good
- Poverty: Average
- Trade: Good
- Highest and lowest income areas in Montana
Unemployment: Excellent
Summary
Generally speaking, an exceptionally large portion of Montanans are employed, earning money, and contributing to the economy, which has played a key role in Montana’s stable and growing economy in past decades.
Details
Montana’s unemployment rate has been steadily dropping since the late 1970s, except during brief periods of economic recession, when it has temporarily skyrocketed.
The graph below, from the U.S. Bureau of Statistics, shows the trend in Montana’s unemployment rate since the 1970s, with grey stripes indicating periods of recession.
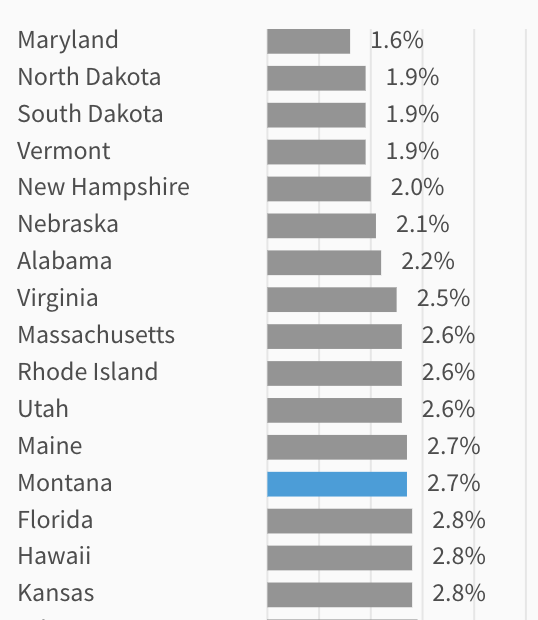
In March of 2023, the unemployment rate in Montana reached a record low of 2.3%. Overall, Montana ranks 13th in the nation for the lowest unemployment rate:
Wages: Average
Summary
Despite a rapidly growing average wage, the state’s average wage still remains well below the national average. This, combined with Montana’s low minimum wage, poses unique problems for some of the state’s constituents.
These factors could have a significant impact on personal disposable income as well, which is a key metric that strongly influences how much of their wages Montana residents put back into the economy, which helps drive stable, consistent economic growth.
Details
Average wages in Montana have remained below the national average for several decades, ranking 44th in the nation:
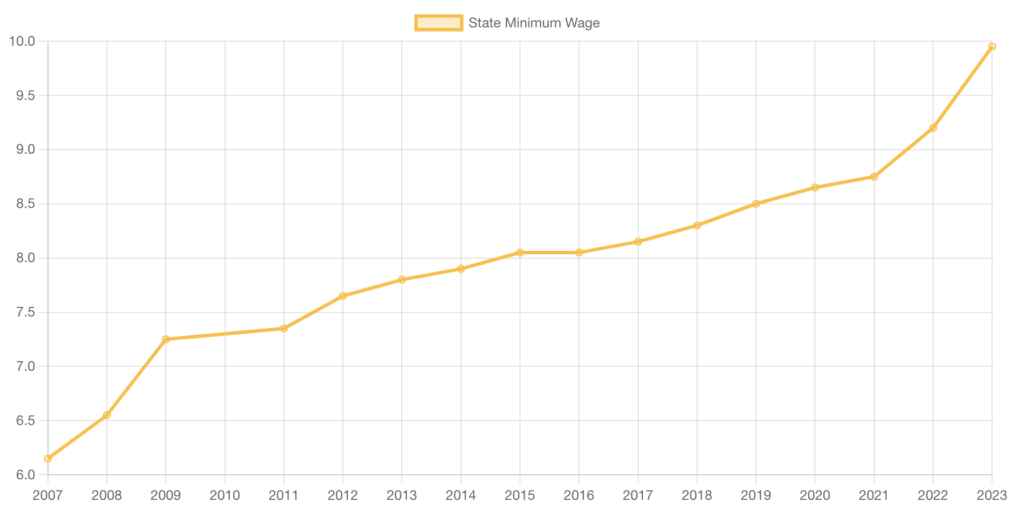
Another issue of key consideration is the state’s minimum wage, which is $9.95/hr. While this is above the federal minimum wage floor of $7.25, it is just the 23rd highest minimum wage of all 50 states.
Not bad, relative to the nation, but such a low minimum wage creates challenges for many people living in this income bracket.
It’s worth noting that, despite Montana’s low average wage and relatively low minimum wage, the state’s average wage has grown at a much faster rate than most other states in the nation.
From 2017 to 2022, annual wage growth in Montana was the 9th fastest in the nation, growing from $42,045 to $54,525.
Wages by Industry
Montana’s highest-paying industries include enterprise management, utilities, mining, professional & technical services, and the finance sector.
The graph* below lists Montana’s industries in order of wage size, with the highest-paying industries at the bottom.
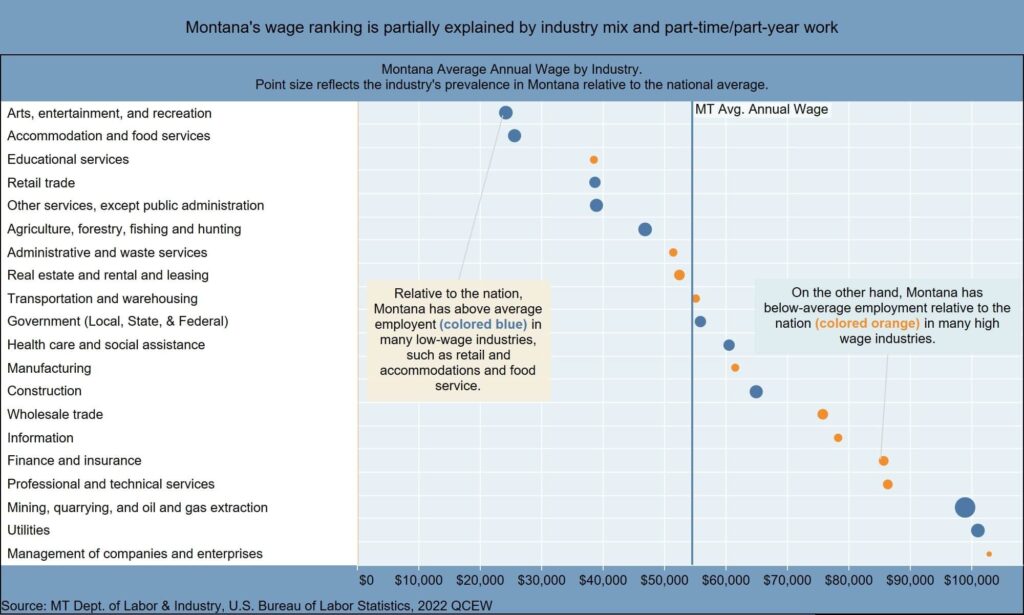
*The color and sizes of the dots are related to employment levels. A blue dot indicates that that industry has an employment rate above the national average, while an orange dot indicates an employment rate below the national average. The larger the dot, the further from the national average.
Per capita personal income: Average
Summary
Unlike wages, which only include income earned through employment, personal income includes wages plus other income sources, such as dividends, social security retirement payments, government benefits, and rental income, among others.
Like wages, per capita personal income in Montana has remained below the national average for nearly a century, which further supports the notion that Montanans have less spending power than residents of the average U.S. state.
Details
The graph below shows historic growth in Montana and nationwide personal income levels since 1929:
As you can see, Montana’s per capita personal income has remained below the national average since at least the 1960s.
Income inequality: Poor
Summary
Montana has less extreme income inequality than the national average. However, slower wage growth in low-wage and middle-wage job wages has contributed to the state’s expanding income inequality for decades.
Details
According to the Montana Department of Labor and Industry, for over a decade, low-wage and middle-wage job wages in Montana have grown faster than the national average.
Meanwhile, higher-wage job wages in the state have grown more slowly than the national average, meaning Montana’s income inequality is not as extreme as the nation’s.
Nonetheless, over the past several decades, the income gap has been expanding. Data from the Economic Policy Institute reveals exactly how much Montana’s income disparity has expanded since the 1970s:
- From the 1970s to the mid-2000s: household incomes for the bottom 20% rose just 13.2%, while the average household income for the top 20% of earners rose 43.7%.
- From the 1990s to the mid 2000s: average income levels for the bottom 20% of earners didn’t rise at all, while for the top 20%, it grew 11.7%.
- Throughout the mid-2000s: 5% of households in Montana had average incomes that were about 11 times bigger than the bottom 20% of households, and 4.3 times bigger than the middle 20%.
Gross Domestic Product (GDP): Good
Summary
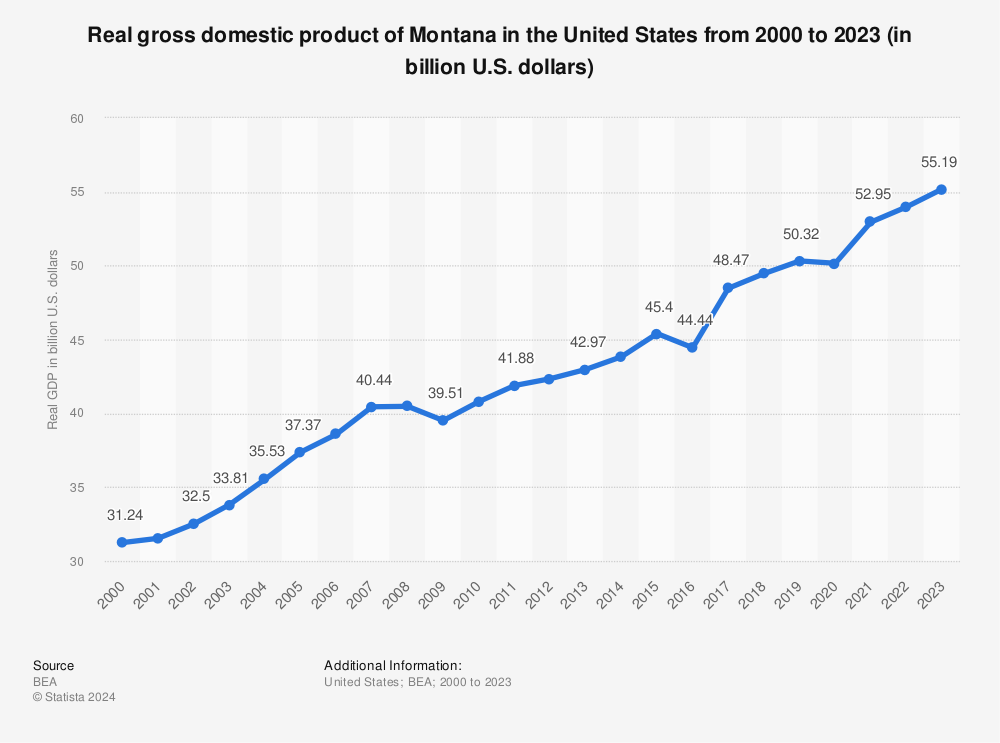
Montana’s GDP has grown steadily for over 20 years, with some downturns during periods of economic recession. From 2000 to 2022, Montana’s GDP grew 2.8% annually, on average, indicating stable, steady expansion of the state’s economy for two decades.
Meanwhile, the standard workweek remained at 40 hours. The state’s rising GDP paired with a constant average workweek can indicate increased efficiency, which is also a key indicator of a strong economy.
Details
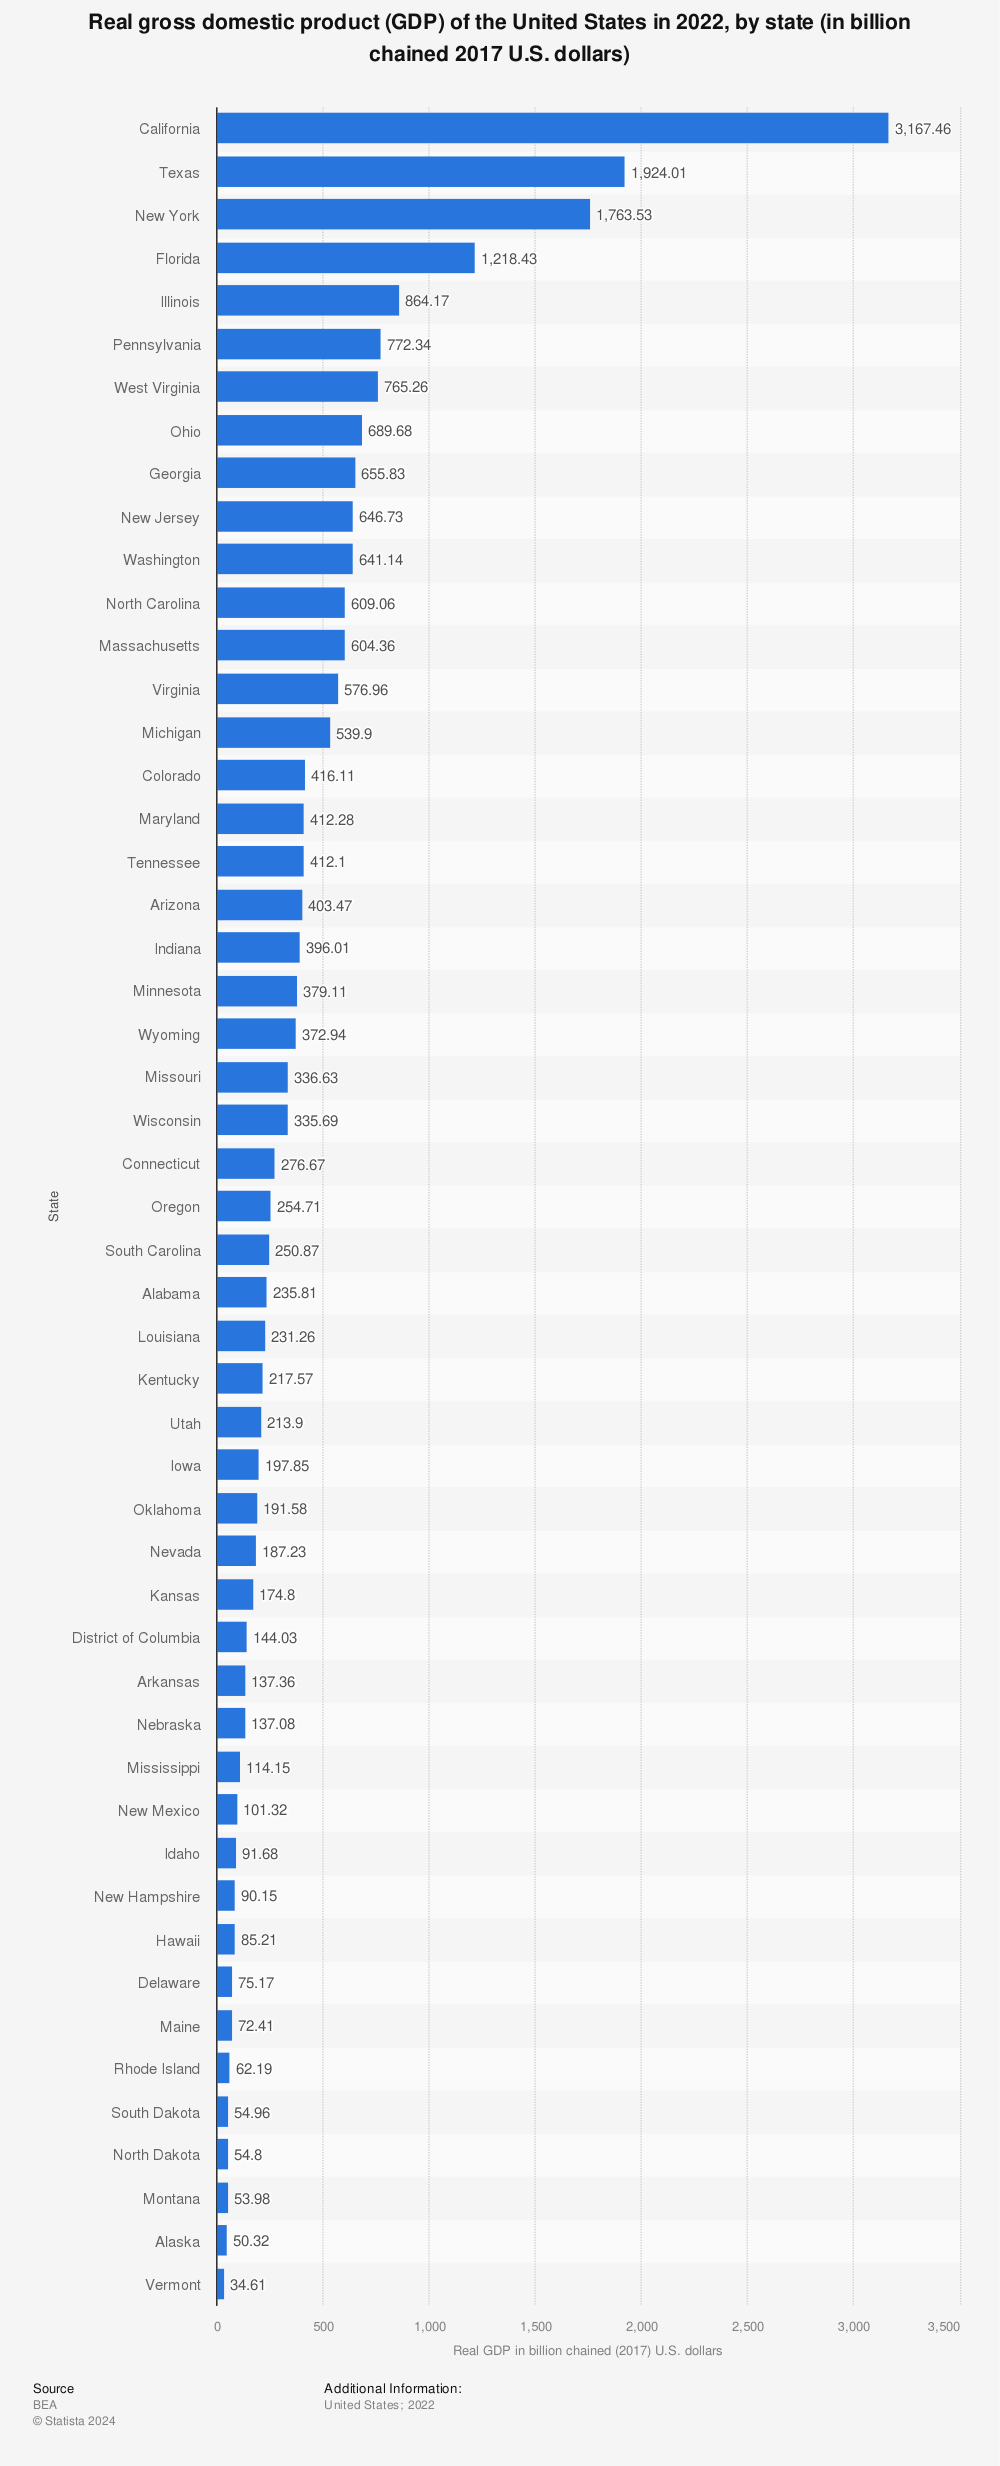
In the past 22 years, Montana’s GDP has grown from $31.24 billion to $48.98 billion. The graph below depicts this growth:
Find more statistics at Statista
In 2022, Montana had the 3rd smallest GDP in the nation, which isn’t surprising, as Montana is a sparsely populated state (it has the 9th smallest population in the nation).
Find more statistics at Statista
However, despite its relatively small size, Montana’s GDP has shown stable and steady growth for decades.
Inflation: Good
Summary
Montana has had stable and steady inflation for the past two decades, except for a period of retracted inflation during the 2008 financial crisis and another one during the significant slowing of the economy in 2015 and 2016.
Montana’s steady inflation rates reveal an economy that is steadily growing, allowing its constituents to better plan their finances, spending, and investments, and helping the economy grow. In turn, this creates more jobs and overall prosperity.
Details
Using the Consumer Price Index (CPI) (which measures fluctuations in the price a consumer pays for a market basket of everyday goods and services), the chart below shows inflation fluctuations in Montana since 2000.
The blue line represents the ‘all items’ CPI, or the full range of goods and services accounted for, while the orange line represents all items less food and energy. Because food and energy are the most volatile of goods, this indicator offers a more accurate measure of underlying core inflation.
As you can see, the graph is mostly flat, meaning growth in the CPI has remained relatively steady, indicating a steady rise in the price of goods and services across Montana during the past two decades. This is a marker of a healthy economy.
The only exception in the above graph is the marked rise in the CPI (inflation) starting in 2020, with the start of the COVID-19 pandemic, which then peaked in 2022. While inflation in Montana has subsided somewhat since 2021, the entire nation has continued to experience high inflation rates ever since.
Most of the sharp drops in inflation occurred during periods of economic recession, such as the 2008 financial crisis.
Poverty: Average
Summary
Like much of the U.S., poverty remains a major problem in Montana. Over the past 22 years, Montana’s poverty rates have fluctuated drastically, hitting their peak of 16.5% in 2013.
However, over the past decade, the state’s poverty level has dropped significantly, reaching 11.9% in 2022.
Details
In the past 22 years, Montana’s poverty rate has dropped a total of 11%. In the past 10 years, it has dropped 27%.
The graph below depicts fluctuations in Montana’s poverty rate since the year 2000, inlcuding a major spike in 2013:

Find more statistics at Statista
These rates closely mirror the national poverty rates for the same period.
Montana’s recent poverty rates of around 12% indicate that a relatively large portion of the population has access to basic needs such as food, housing, and healthcare.
Relative to other states, such as California (16.4%), Montana’s poverty rates are low, which has partially lent to its stable economy.
While low poverty rates can sometimes indicate less extreme income inequality and better distribution of wealth, Montana does not have healthy income distribution (as I discussed above), and poverty remains a serious problem across the state.
Trade: Good
Summary
Trade has played a key role in Montana’s economy for decades, supporting 136,000 jobs and generating a significant portion of state revenue. The value of Montana’s exports has continued to grow, with an exceptional uptick starting in 2020 that has lasted up to today.
Exports are not the primary source of revenue for Montana, but trade has significantly contributed to Montana’s overall stable and healthy economy for decades.
Details
Montana’s exports account for roughly 3.4% of the state’s GDP and support 136,000 jobs across the state.
Montana’s biggest industries are all in the primary sector, including agriculture, forestry, mining, and energy production, and products from these industries comprise some of Montana’s main exports.
These exports include Copper oxides and hydroxides ($171M), Electrical energy ($135M), and cattle ($113M). Other top exports come from the chemical and machinery sectors.
Montana’s top export markets include South Korea, China, and Japan.
The chart below depicts the growth in Montana’s imports and exports since 2017:

Find more statistics at Statista
It’s worth noting that Montana exports far less than it imports, resulting in a significant trade deficit. While this fact alone doesn’t indicate a poor economy, large trade deficits can have negative impacts.
However, while Montana runs a trade deficit, the state Governor, Greg Gianforte, signed a bill into law paying off the state’s debt in 2023 and eliminating the budget deficit.
Highest and lowest income areas in Montana
The list of the fastest-growing regions of Montana changes over time. High agriculture prices and the boom in shale oil extraction in the Bakken in northeast Montana in the early 2000s led to rapid economic growth in the surrounding counties until 2014, when the price of oil dropped.
Today, the oil industry in northeast Montana is still booming, but urban areas and western counties lead the state in terms of rising income levels and employment.
The interactive graph below shows per capita personal income growth from 1969 to 2021 for the 12 highest income areas in Montana:
Many of the counties in this graph are home to Montana’s major cities and tourist destinations, such as Billings (Yellowstone), Bozeman (Gallatin), Missoula (Missoula), Glacier National Park (Flathead), and Red Lodge (Carbon). Seeing these regions on this list is no surprise.
However, the most notable spike on the graph is in Richland County (brown), which peaked in 2014 as a result of the oil boom in the Bakken oil field.
It’s also worth noting that Madison County tops the list with a per capita personal income of $74,468 in 2021. While there are no major cities here, its labor shortage and rising inflation are primarily responsible for its exceptionally high per capita personal income measurement.
In case you’re considering moving to Montana and you’re interested in personal income levels in different regions of the state, be sure to check Montana’s cost of living. We cover that in detail here: Why is Montana so expensive?
Discover more about Montana’s economy
- Is Montana rich in natural resources?
- This is Montana’s top export (it’s not wheat)
- Montana’s top 7 industries – real estate, wheat, and…
- This is Montana’s main industry (no, it’s not wheat)
- Wheat, Montana’s biggest crop
- Montana vs Idaho – What’s the difference?
- Wyoming vs Montana – What’s the difference?

